Pradeep Ravindranath
Thirteen years across molecular modelling, clinical machine learning, autonomous-vehicle perception and shipped consumer software — moving between the room where a result has to be defended and the room where it has to be shipped and paid for. Below is the work itself, newest first. Every figure is from a project I did, in a domain I had to learn first.
Trained to defend a result
- PhD, Computational Chemistry
- Singapore-MIT Alliance · 2008–2013
Full fellowship. Inverse design of protease inhibitors. - MSc, Informatics (AI)
- University of Edinburgh · 2006–2008
Trained to run the business
- MBA
- UC San Diego, Rady School · 2016–2018
Merit scholarship. Technology management. - Since then
- Co-founder & CTO, fractional CTO, and founder of an independent practice.
The dates overlap on purpose. I took the MBA in the evenings between 2016 and 2018 while working as a Senior Computer Scientist at USC's Alzheimer's Therapeutic Research Institute — leading the team whose platform helped secure a $70M NIH grant. I did not move from research to business. I have been doing both at once since 2016.
Applied-research sprints
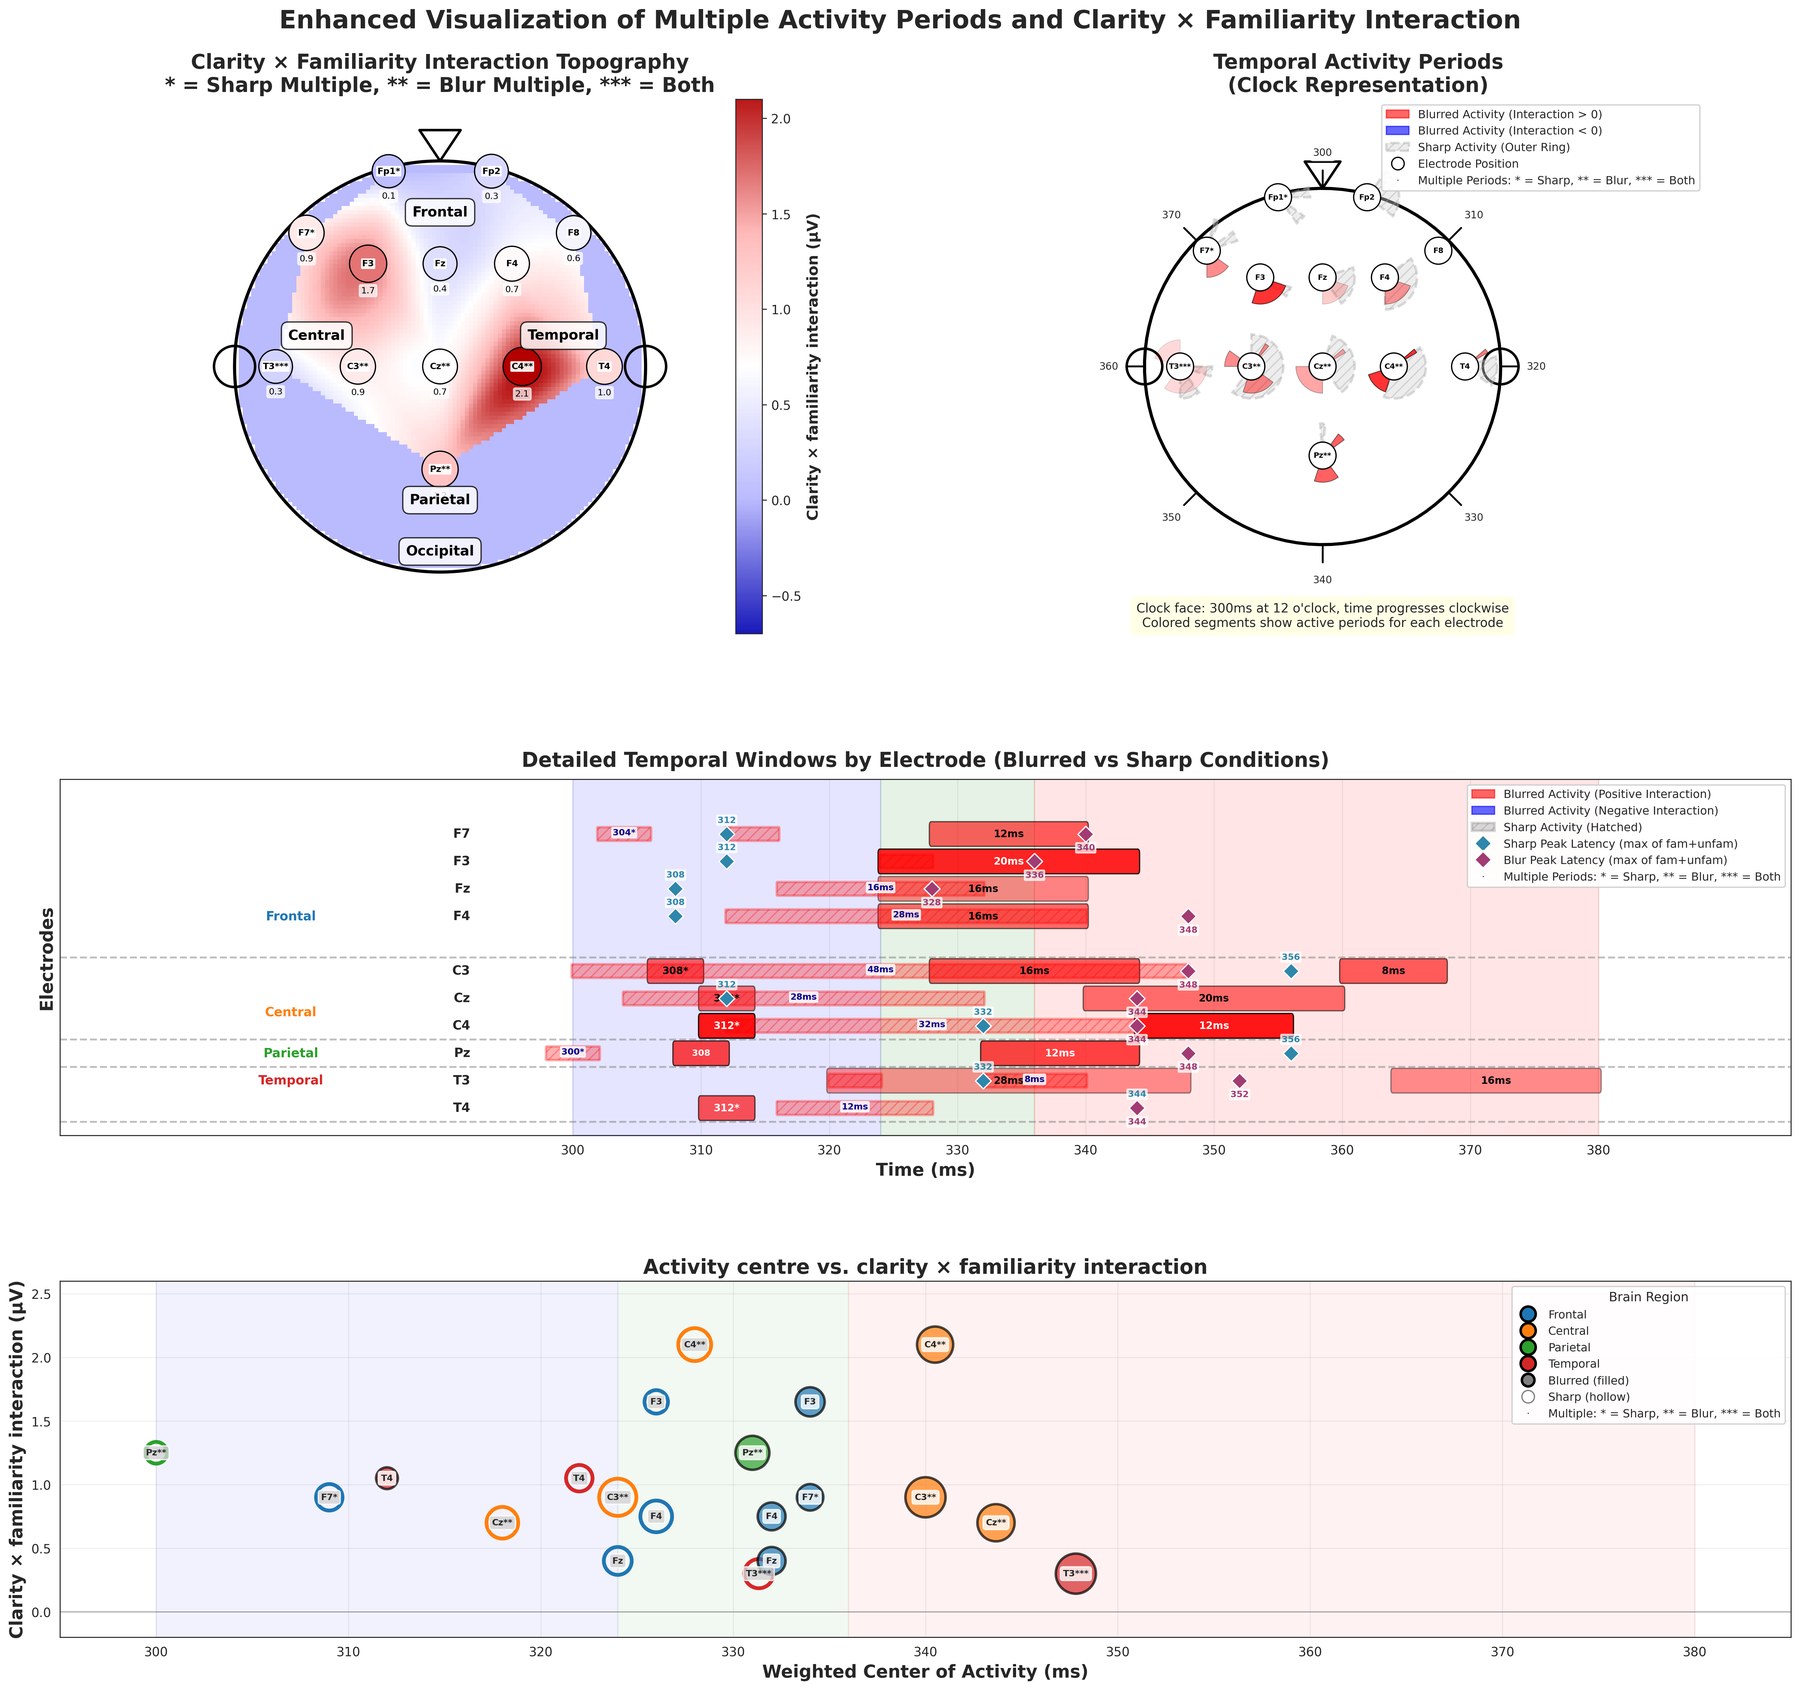
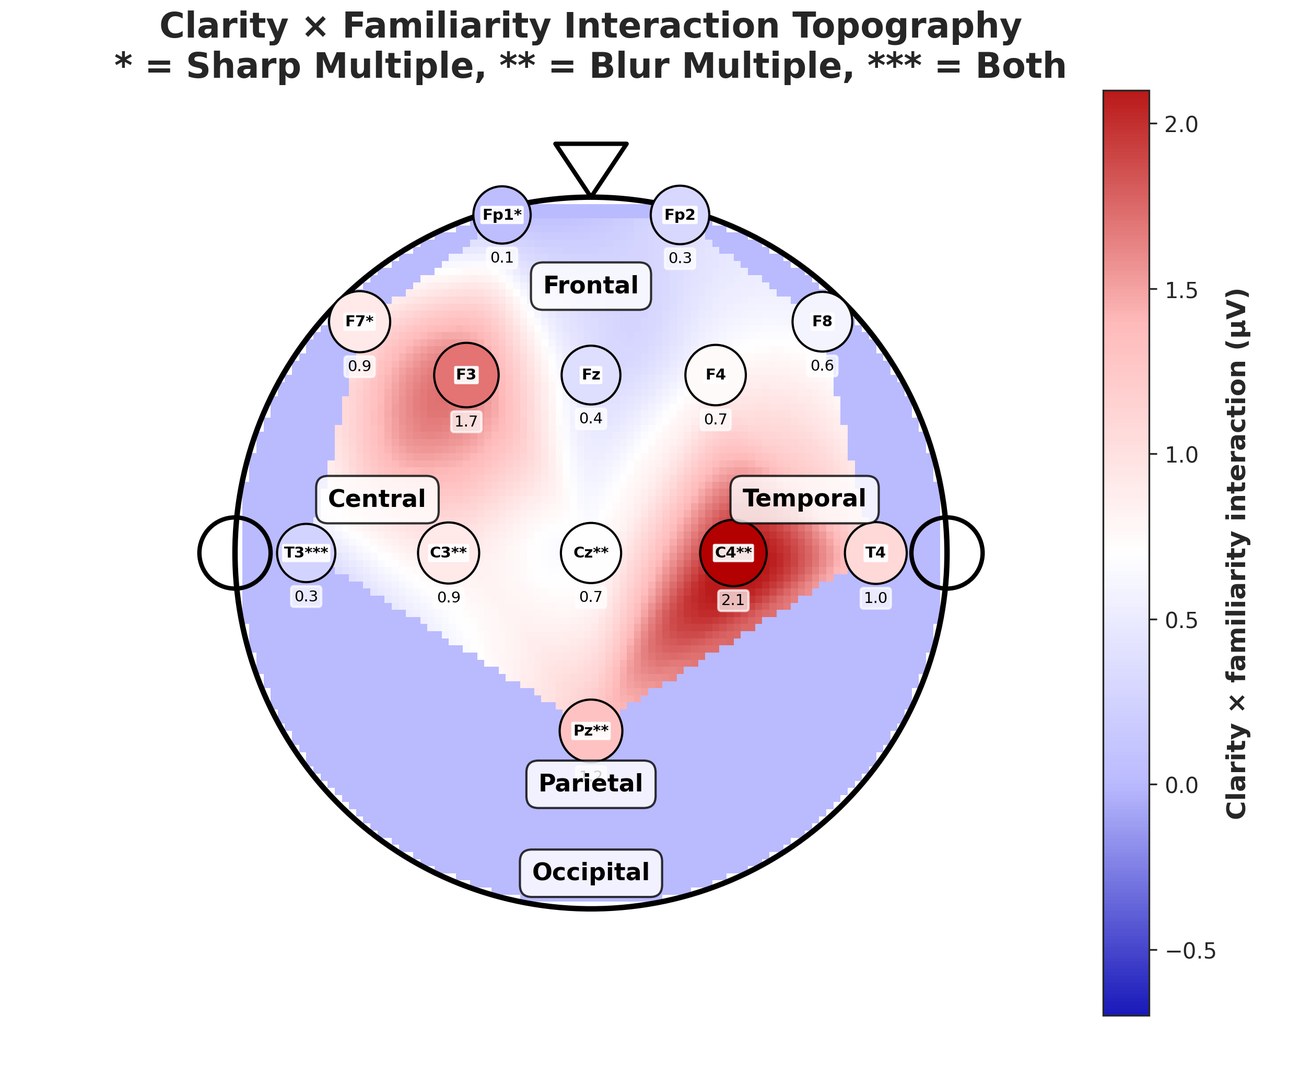
Research work for people who hold the domain and not the computational tooling. One engagement took a neuroscience thesis written in Russian in 2005–06 and rebuilt its analysis on current tooling — translation, computation and defence figures, carried across two languages and a technology generation without losing the domain truth.
On-device AI products
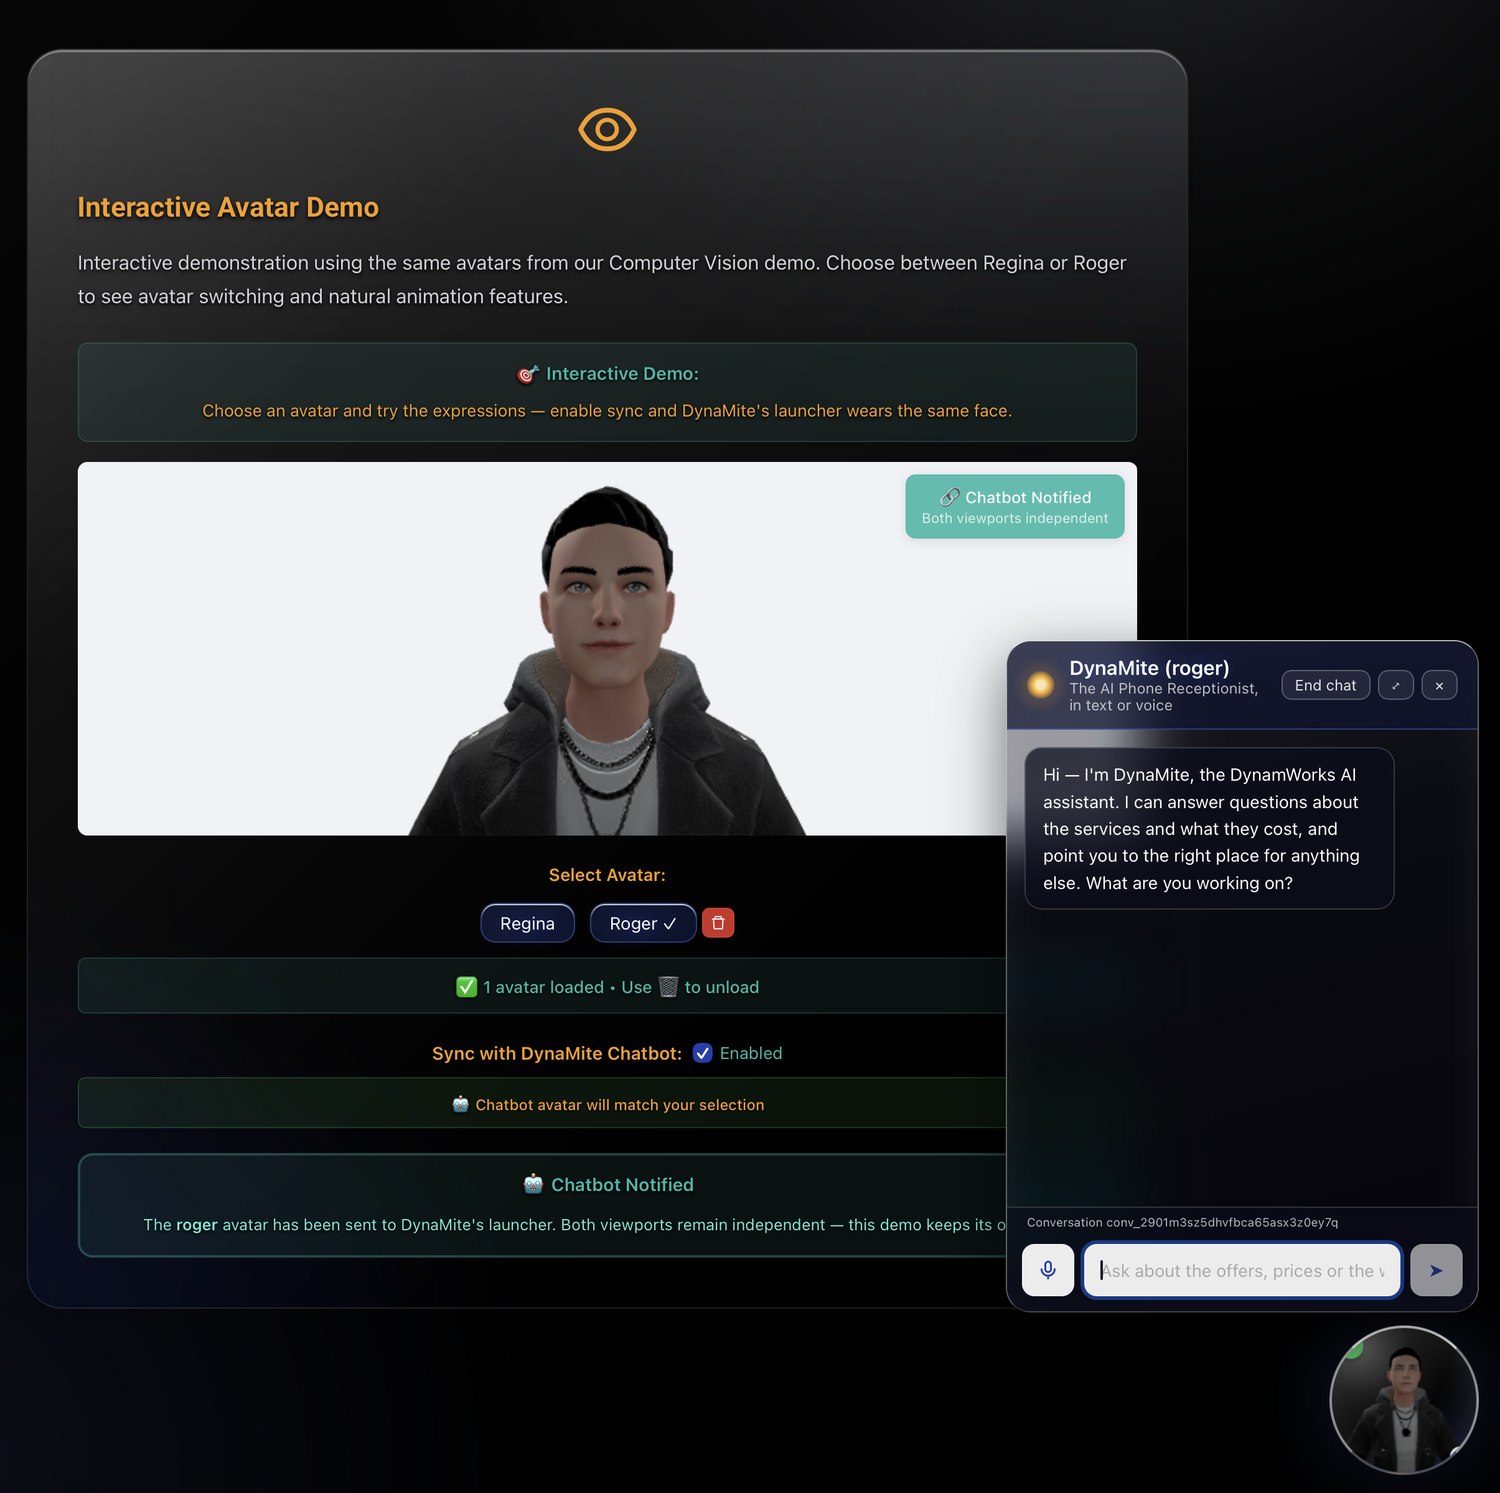
An independent practice whose products are in the App Store rather than in a slide deck — a Tamil and Tamil Brahmi keyboard, a handwriting-to-font app, a browser computer-vision playground, and an agentic video-analysis framework released open source. Inference runs on the user's machine, which forces every honest engineering tradeoff at once: memory, latency, model size, quality.
Things you can open right now
Real-time pose detection, 478-point landmark tracking and edge detection, all processed locally — no install, no server, nothing uploaded. Open it on a laptop with a webcam and it runs in the tab.
dynamcv.app.dynamworks.com · dynamworks.com · VisionUX on GitHub
A clinic's software, and its operations
Perirosa — an App Store patient app for perimenopause and HRT tracking that produces twelve-month clinical summary PDFs, built with no account, no cloud and no analytics: a year of a patient's most sensitive data stays on their phone, out of reach of the clinic and of me. Alongside it, an AI phone receptionist that triages callers and answers strictly from per-question scoped sources — it books nothing, reaches no records and gives no medical advice. I also run the practice's bookkeeping, filings and administrative workflows.
Fractional CTO to a regulated tax platform
Led a twenty-four-person cross-functional team under a single technical vision, consolidating nineteen services and four datastores onto one system of record while the platform stayed live for its users. The engagement has ended; the rest of it stays with them.
Multi-sensor calibration for autonomous systems
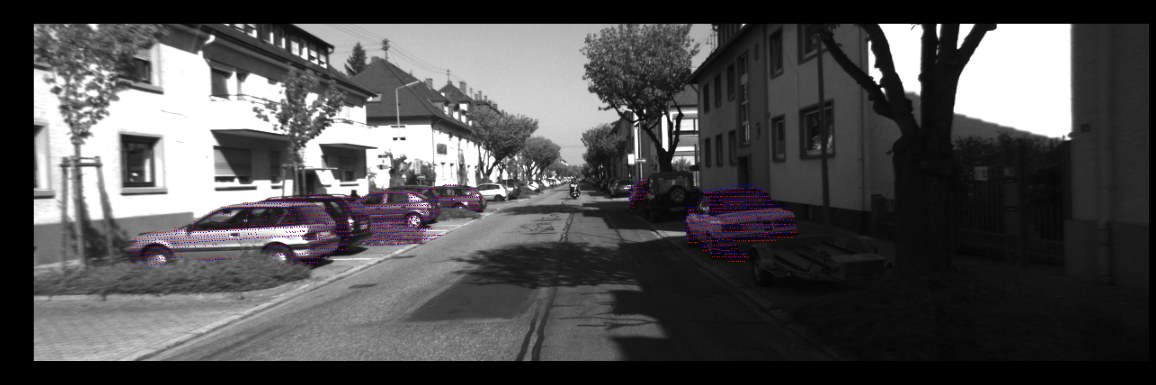
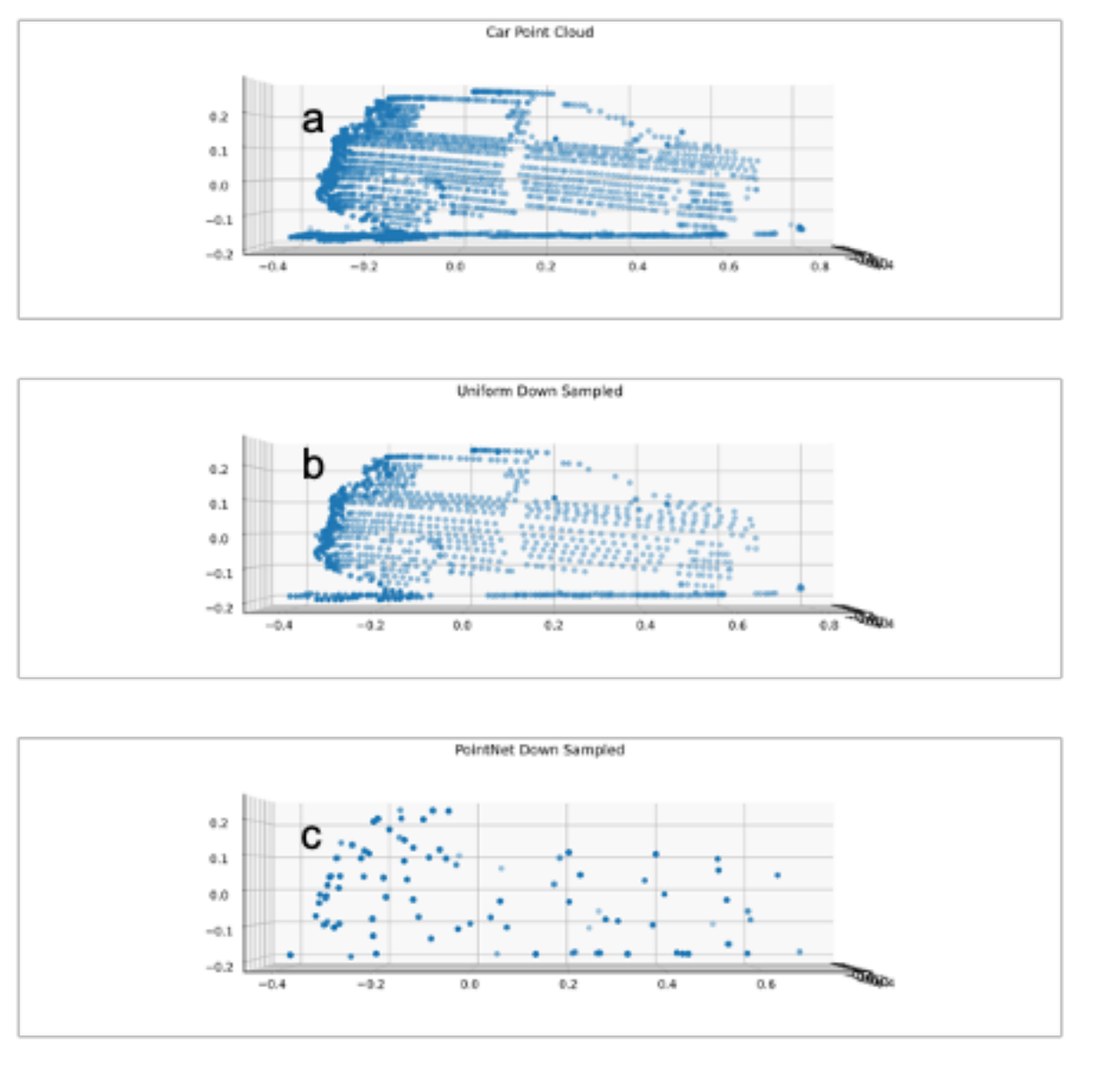
Co-founded a venture-backed sensor company in 2020 and led its technology full-time from 2021, once I left USC: continuous dynamic calibration across LiDAR, radar and camera, running under real-time embedded constraints rather than as an offline batch. Productized as Curium Calibration Edge and launched at CES 2023; covered by a published international patent application. The domain is far from biology — registering one modality onto another is the same problem.
Machine learning into clinical research practice
Led the eight-person team building an AI-powered electronic data capture platform for multi-site clinical research — the platform that helped secure a $70M NIH grant — and deployed a medical-coding model that cut coding time from days to hours. Multi-modal classification from video and audio, and adverse-event classifiers benchmarked against the established method rather than reported in isolation. Four peer-reviewed publications, presented at AAIC in London and Chicago. Patient data; nothing from it belongs on a public page.
Docking software that is still in use
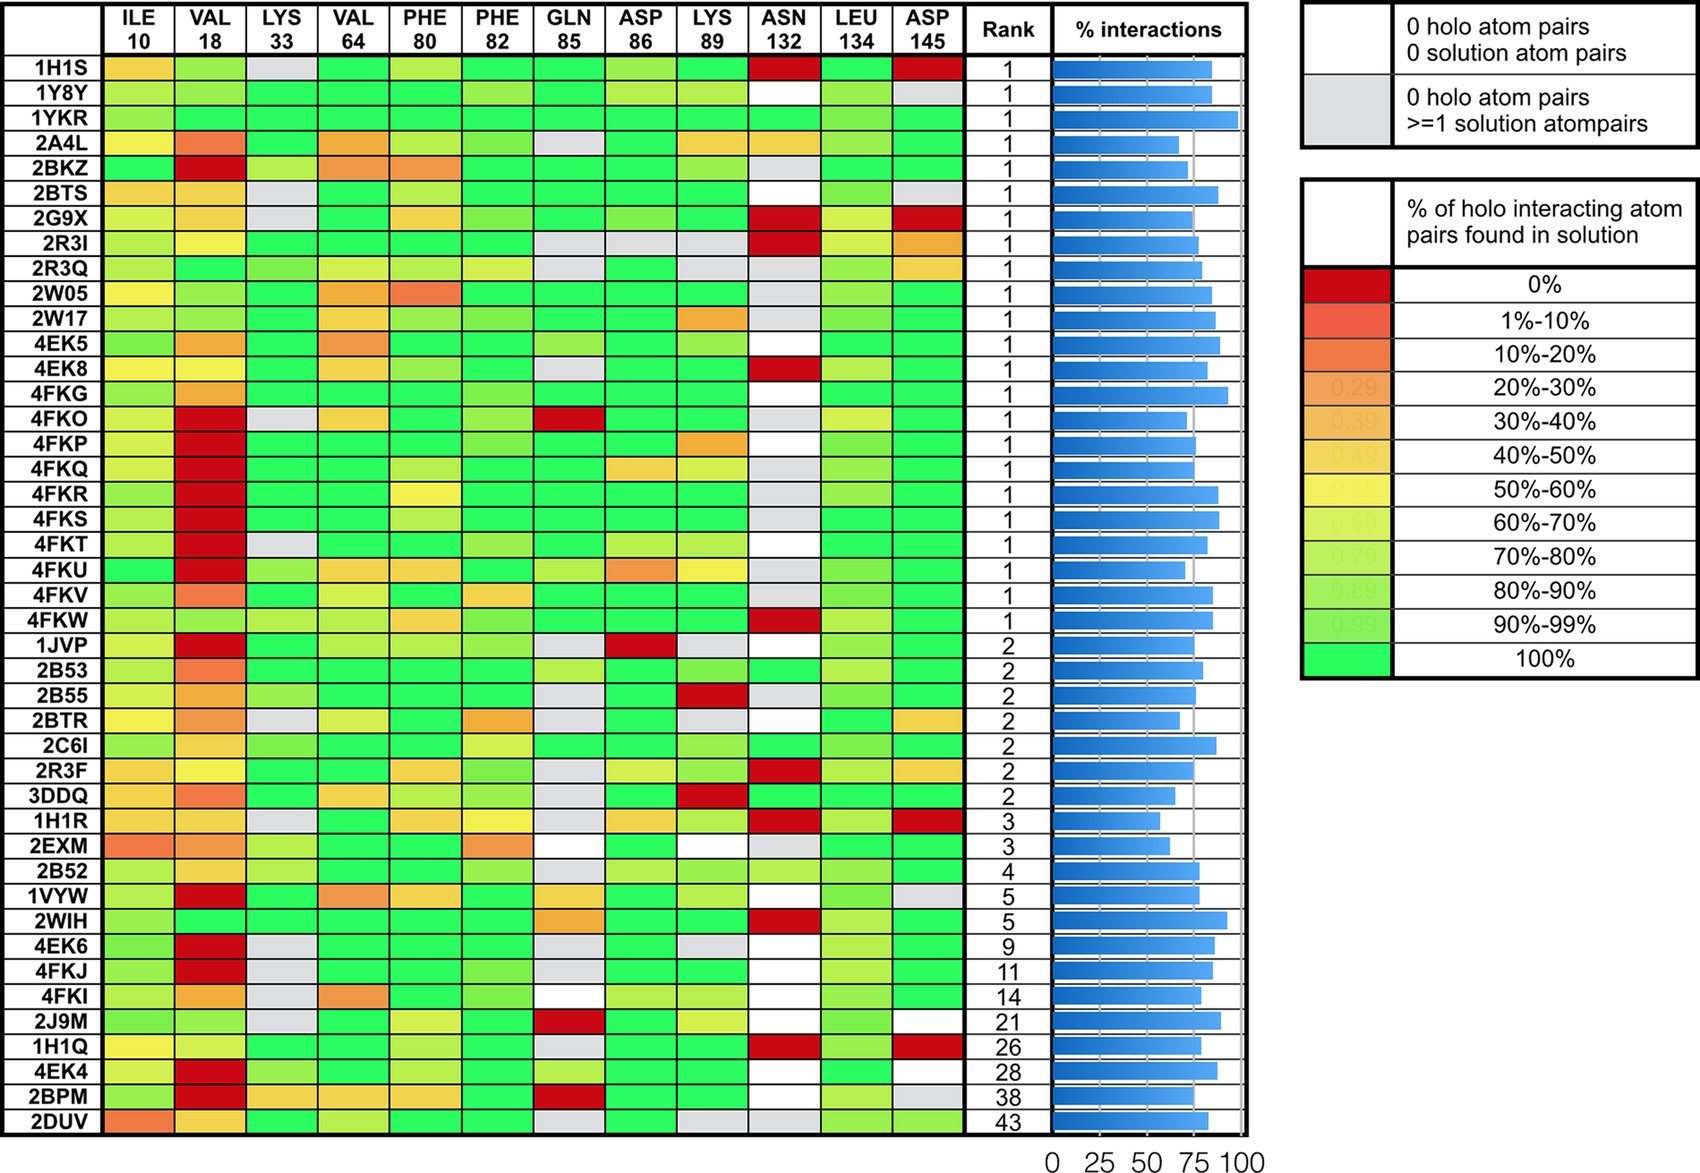
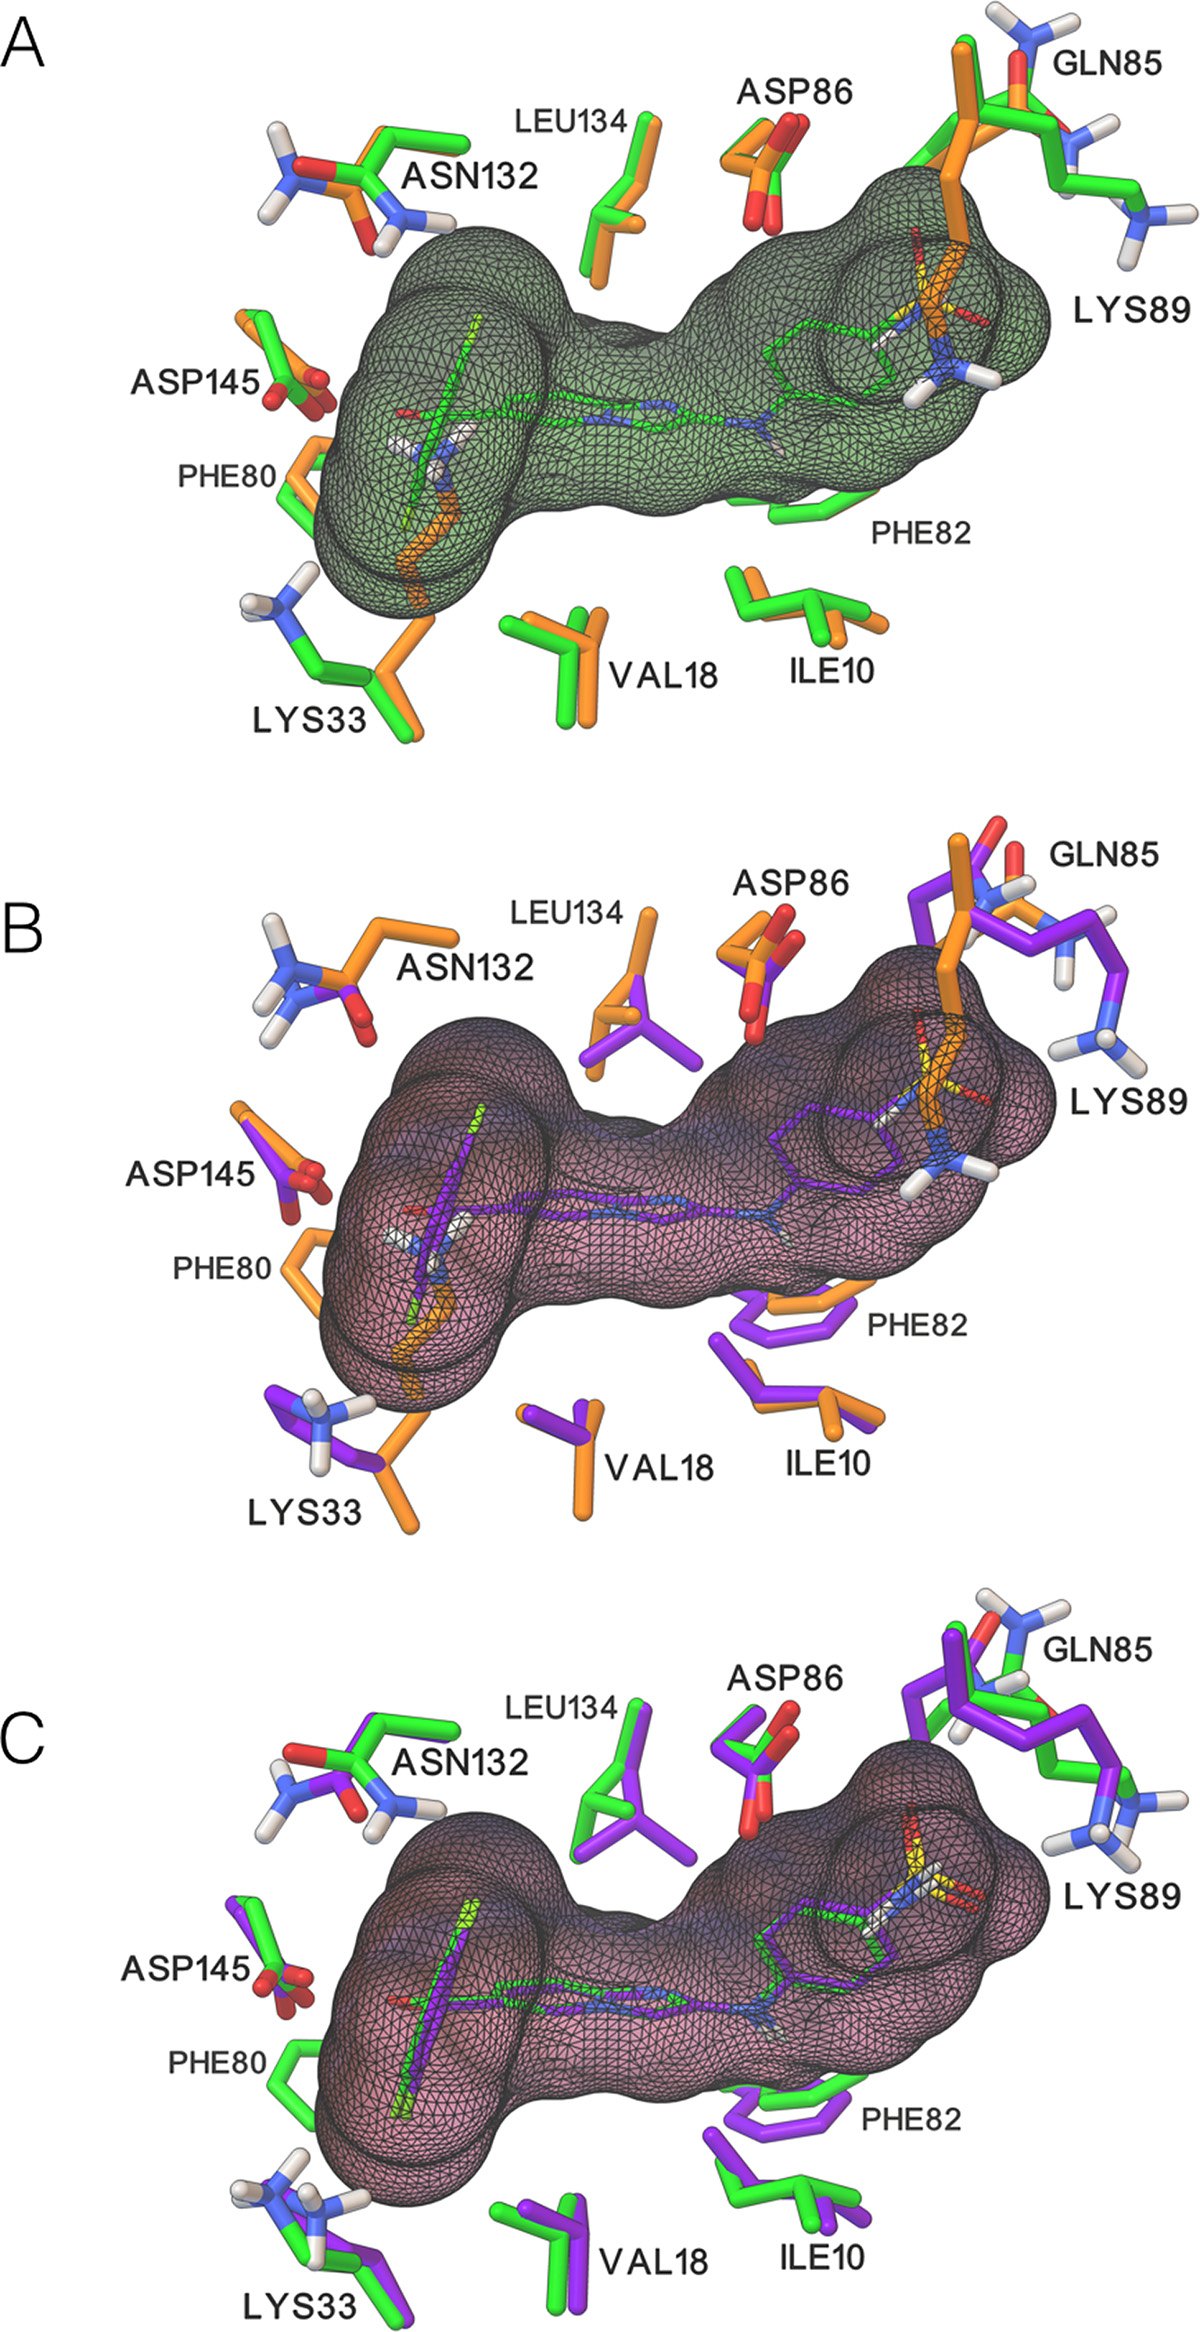
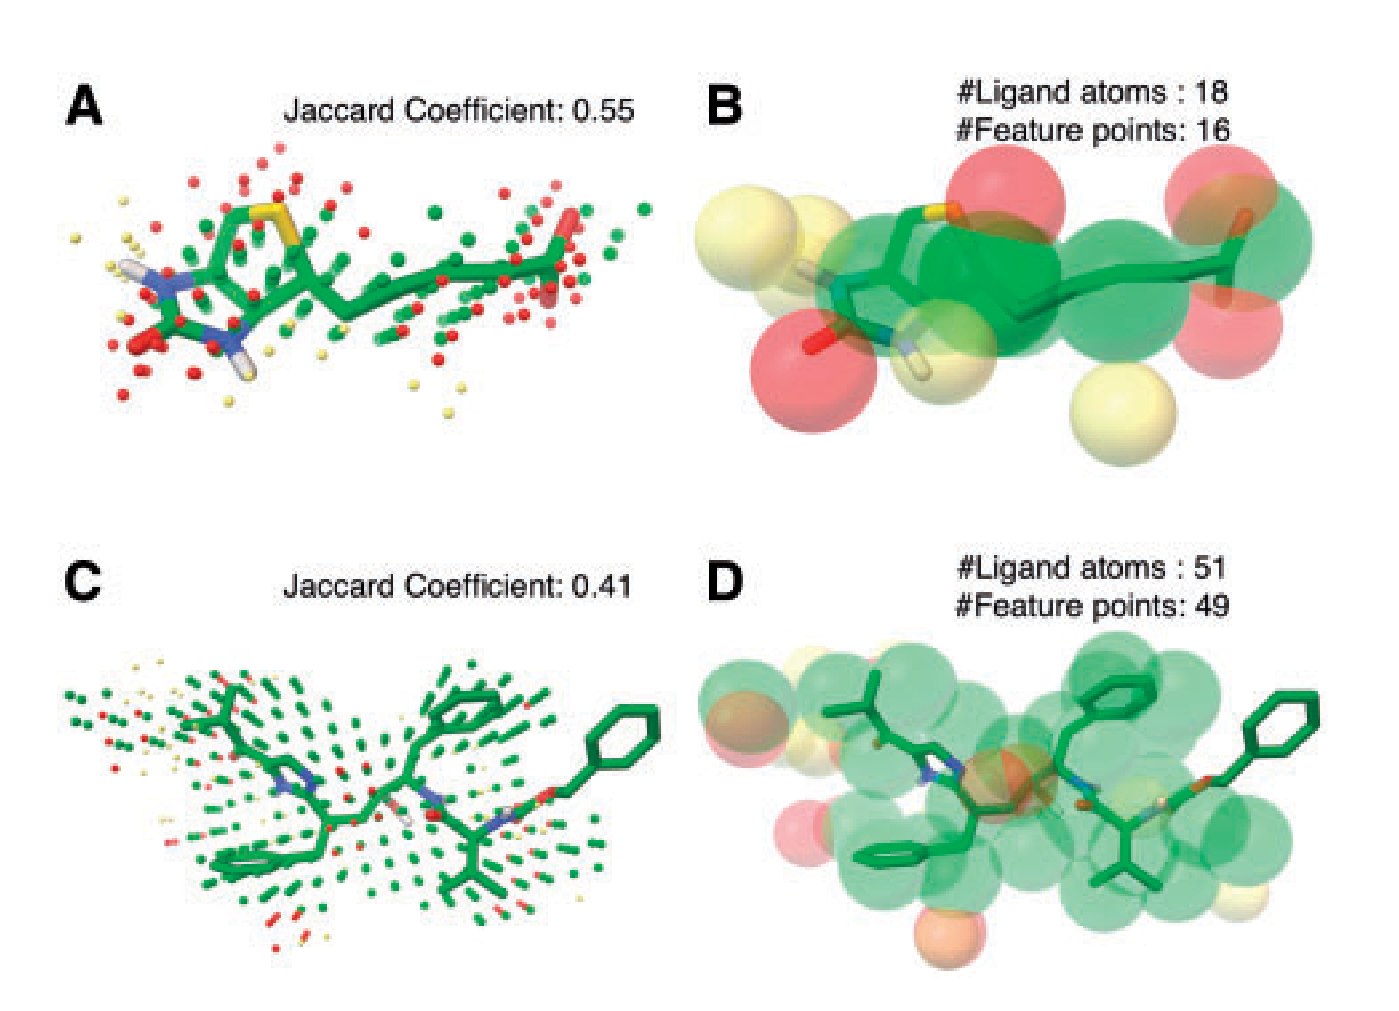
Built AutoDockFR, a protein–ligand docking engine that handles receptor flexibility — up to fourteen flexible side chains — where most tools assume the receptor holds still, and AutoSite, which finds where a ligand can bind and predicts the shape it would take there. Both ship in the AutoDock Suite and are still cited a decade on, which is the only durability test that counts for research tooling.
Designing inhibitors that resistance cannot outrun
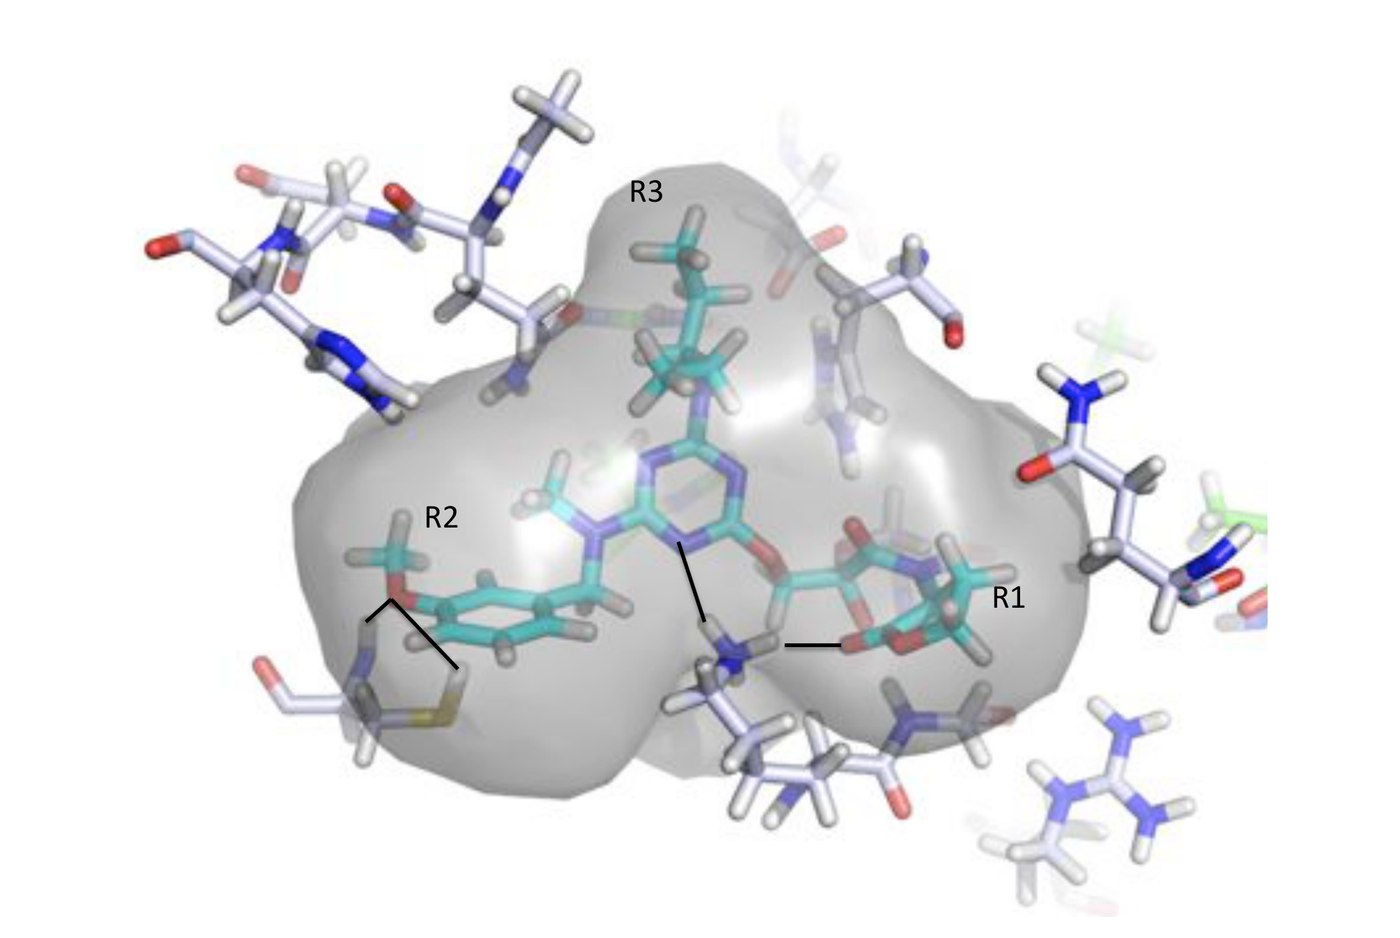
Computational design of inhibitors for the hepatitis C NS3/NS4A protease, shaped to stay inside the space the natural substrate already occupies — so a mutation that escapes the drug also costs the enzyme its own function. Hierarchical scoring: fast grid energies first, then dead-end elimination and A* to rank candidate functional groups, then expensive accurate energy functions on the survivors.
Watch it run
A decade apart, both still running. The older is research software that is still cited; the newer runs in your browser while you read this.
Published, cited, still in use
What I do now
I run DynamWorks, an independent practice taking domain-expert product visions into production — fractional CTO engagements, applied-research sprints, and hands-on delivery for healthcare, research and regulated clients. I take the work where the domain matters as much as the engineering.
pradeep@dynamworks.com · +1 (858) 366-2815
dynamworks.com · linkedin.com/in/paravindranath
AutoDockFR figures from Ravindranath PA, Forli S, Goodsell DS, Olson AJ, Sanner MF, PLoS Comput Biol 11(12):e1004586 (2015), CC BY 4.0. AutoSite figures (Bioinformatics 32(20), 2016), sensor-calibration figures (Proc. SPIE 11525, 2020) and doctoral thesis figures reproduced by their author. EEG/ERP figure reproduced with the permission of Oksana Shelest.